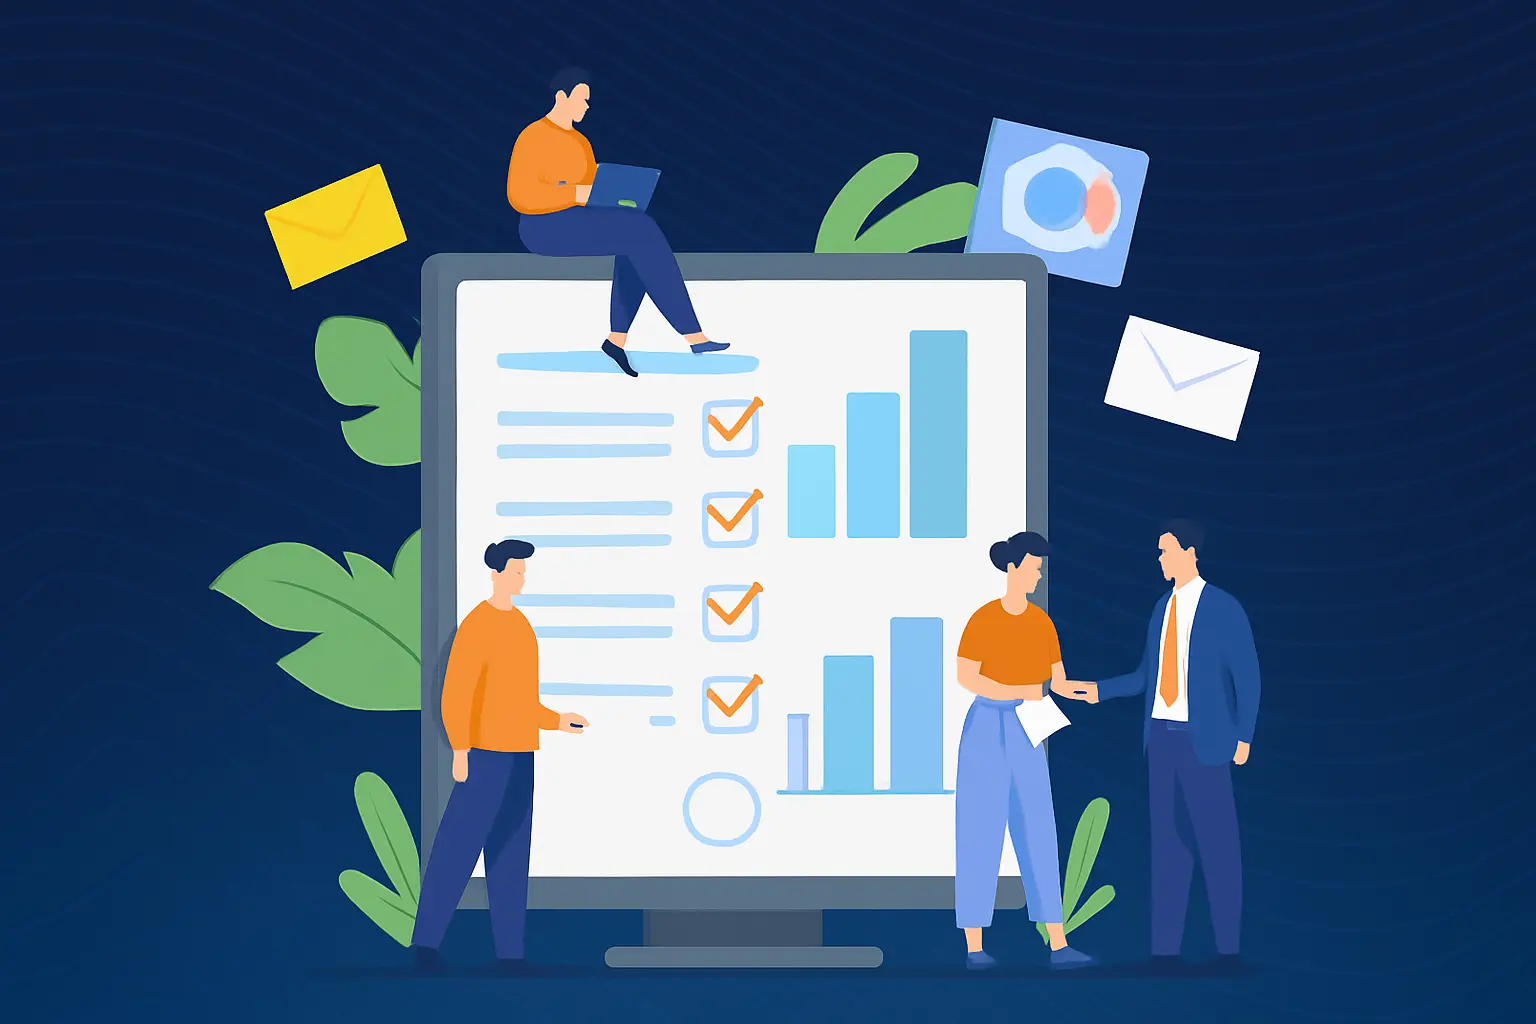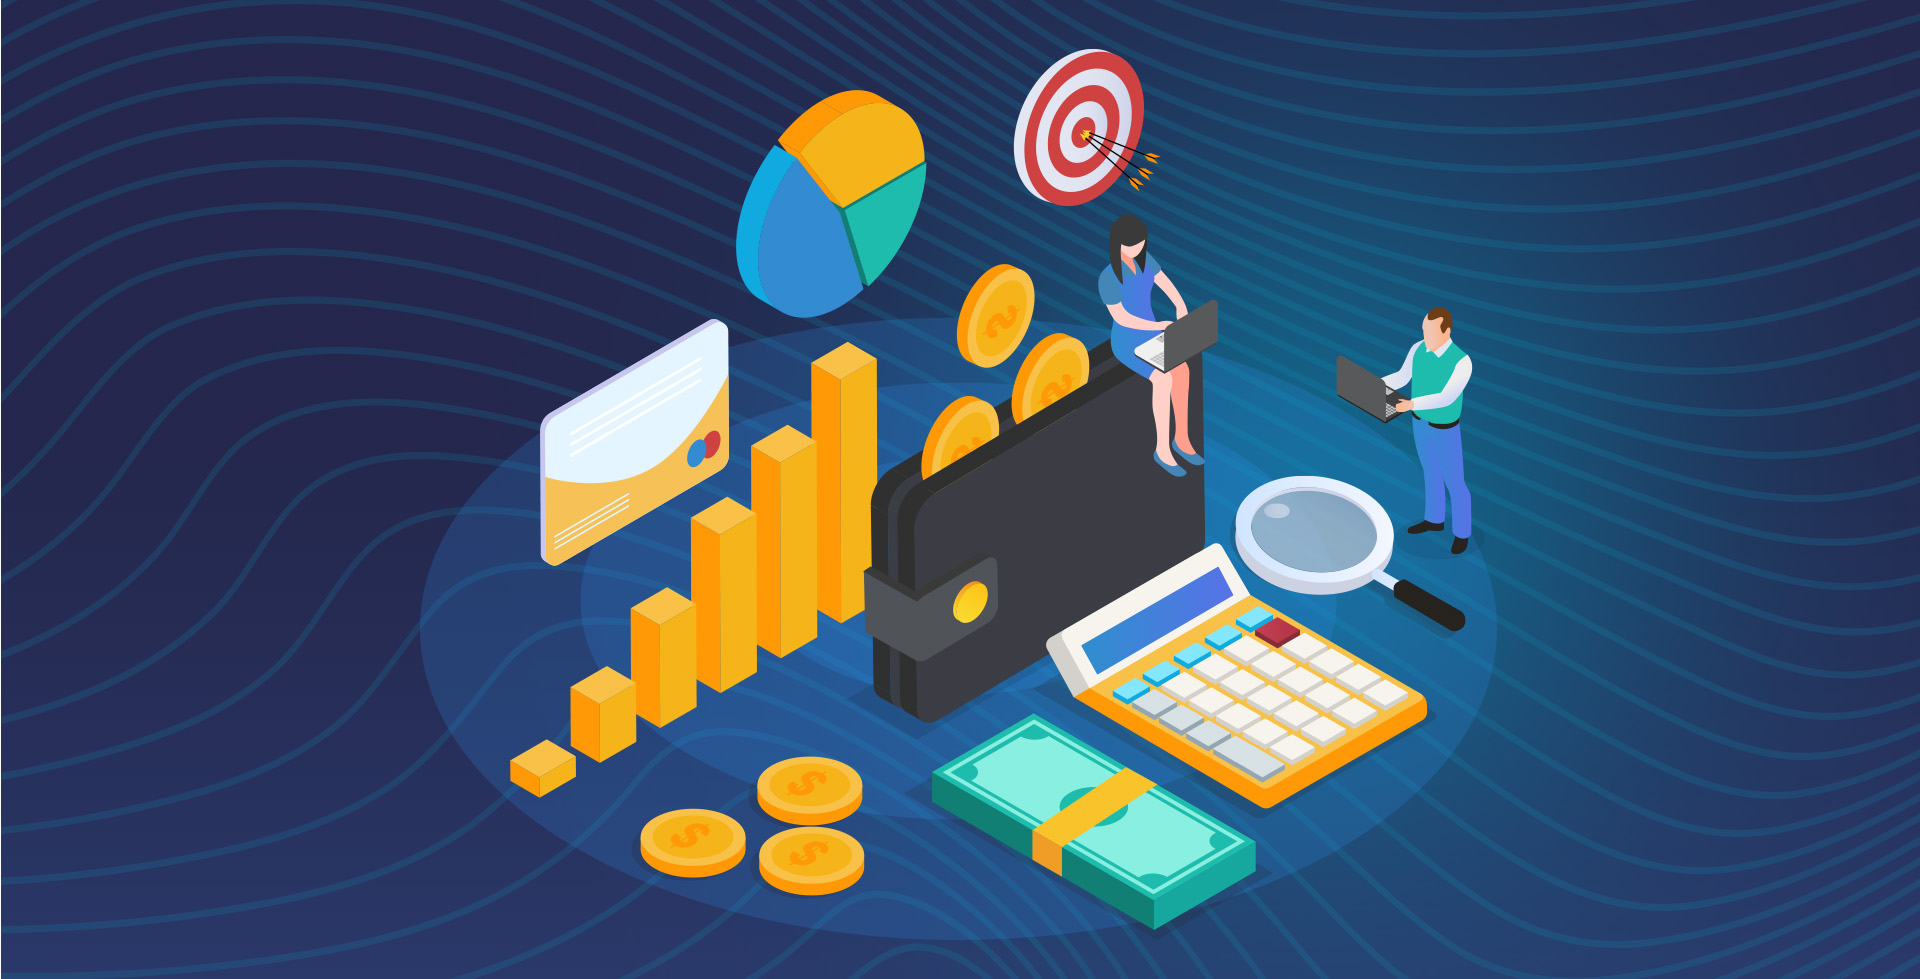


Data is only as powerful as the story it tells. That’s why you need a procurement dashboard. Unfortunately, performance reporting is still stuck in spreadsheets, which are static, siloed, and outdated the moment they’re shared.
For a P2P Lead or Procurement Director, this makes it nearly impossible to see what’s working, where risks are emerging, or how spend is truly aligned with business objectives.
A well-designed procurement dashboard acts as a control center for procurement strategy. By bringing together real-time metrics on spend, supplier performance, compliance, and cycle times, dashboards turn raw data into actionable insights, highlighting trends before they escalate into issues. They can even surface opportunities that align procurement with finance and business stakeholders.
With interactive visuals and cross-functional visibility, dashboards enable you to shift from number-chasing to value creation.
This blog explores how procurement dashboards support smarter decisions through making KPIs trackable and actionable, and helping to align all stakeholders on the same business goals.
Key Takeaways
- Procurement dashboards unify fragmented data into a single, real-time view that improves decision-making, strengthens supplier management, and connects procurement directly to business outcomes.
- Dashboards should focus on meaningful KPIs, automate data updates, and provide role-based insights tailored to procurement, finance, and executive stakeholders.
- Embedding benchmarking, ESG indicators, and risk metrics transforms dashboards from static reporting tools into strategic performance engines that drive resilience and enterprise value.
What is a Procurement Dashboard?
A procurement dashboard is a centralized, visual tool that consolidates key metrics, benchmarks, and performance indicators across the Source-to-Pay process.
Unlike static reports, dashboards provide real-time visibility into spend, supplier performance, compliance, and process efficiency. These insights enable procurement leaders to monitor and act on critical trends – as they happen.
By integrating data from multiple systems such as ERP, Source-to-Pay (S2P), and Quality Management Systems, dashboards become a dynamic resource that helps you to align decisions with business goals, improve collaboration, and manage supplier performance proactively.
Let’s explore the differences between procurement dashboards and other reporting tools.
Key Differences between procurement dashboards, spend analysis tools, and ERP dashboards
Procurement dashboards, spend analysis tools, and ERP dashboards all deliver valuable insights, but each focuses on a different set of data or decision-making needs. The table below outlines the key differences.
| Feature | Procurement Dashboard | Spend Analysis Tool | ERP Dashboard |
| Primary Purpose | Monitor procurement KPIs and workflows in real time | Analyze historical spend to identify savings opportunities | Provide a holistic view of all business operations |
| Data Scope | Purchase orders, supplier performance, procurement cycle times | Detailed spend categories, suppliers, cost trends | Finance, inventory, HR, production, sales |
| User Group | Procurement managers, category managers, buyers | Finance teams, procurement analysts, executives | Department heads, company leadership |
| Time Focus | Real-time and short-term operational tracking | Historical and trend-based analysis | Real-time with historical summaries |
| Integration Needs | ERP, supplier portals, P2P systems | ERP, AP systems, procurement records | All business systems |
| KPIs Covered | PO cycle time, cost savings, supplier on-time delivery | Total spend by category, maverick spend, supplier consolidation | Revenue, cash flow, production output, procurement metrics |
| Decision Support | Day-to-day procurement efficiency | Strategic sourcing and cost optimization | Company-wide strategic and operational planning |
Procurement dashboards excel at real-time monitoring of day-to-day KPIs such as purchase order cycle time or supplier on-time delivery, while spend analysis tools are built for deep dives into historical data to uncover cost-saving opportunities and sourcing strategies.
ERP dashboards, on the other hand, provide a broader organizational lens, connecting procurement metrics to company-wide operations such as finance, HR, and production.
In practice, procurement dashboards keep teams agile in daily operations, spend analysis tools guide longer-term sourcing strategies, and ERP dashboards connect procurement performance to enterprise-wide goals.
Next we’ll take a closer look at procurement analytics dashboards and why they’re essential tools for the procurement function.
Why Procurement Dashboards Are Critical for Modern Businesses
Procurement dashboards are indispensable tools for procurement teams because they provide a single, dynamic view of performance. They support operational efficiency and strategic decision-making in the following ways:
- Cost savings tracking. Dashboards make it easy to monitor realized and projected savings in real time, ensuring finance and procurement stay aligned on measurable impact.
- Supplier performance monitoring. By consolidating KPIs such as on-time delivery, defect rates, and SLA adherence, dashboards highlight strengths and expose underperformance issues early.
- Risk mitigation via data transparency. Real-time visibility into spend, supplier dependencies, and contract exposure helps you identify vulnerabilities before they escalate into disruptions.
- Compliance and audit readiness. Automated data capture and reporting help to ensure you can maintain accurate records. This enables quick responses to internal or compliance audits.
By providing these capabilities, procurement analytics dashboards enable you to improve accountability and operational resilience, while adding strategic value for the business.
Why Most Procurement Dashboards Fail Before They Start
Many procurement dashboards fail to provide value because they’re built on incomplete or siloed data, leaving users with KPIs that don’t tell the full story. Without consistent definitions for savings, supplier performance, or cycle times, dashboards can create a lot of confusion, causing finance to question the numbers and stakeholders lose confidence in reported results.
What’s more, dashboards with static visuals only increase the frustration, because they don’t show real-time trends or provide actionable insights.
Effective dashboards require thoughtful design, consistent metrics, and integration across systems. Without those foundations, even the most polished dashboard risks becoming a costly report no one trusts or even uses.
Fragmented Data Sources Make Visibility Impossible
One of the biggest reasons dashboards fail is because they contain fragmented data. When they pull metrics from disconnected ERPs, Excel spreadsheets, and departmental tools, you’re left reconciling conflicting numbers instead of acting on them.
Inconsistent definitions and data silos can also result in double entries, broken links, and reporting delays. By the time insights reach decision-makers, they’re already outdated.
A centralized platform like Ivalua solves this problem by unifying data from ERP procurement systems, P2P, and supplier systems into a single source of truth. This eliminates the need for manual reconciliation and ensures KPIs are consistent. Instead of debating which numbers are correct, the team can focus on what actions to take.
Teams Track Too Many Metrics That Don’t Drive Action
Another common pitfall is measuring everything without knowing what procurement dashboard metrics actually matter. Dashboards that are overloaded with irrelevant numbers create noise rather than clarity. For example, knowing how many purchase orders were raised doesn’t matter as much as knowing PO cycle time, which directly reflects process efficiency.
The goal isn’t more data; it’s smarter data. By focusing on fewer, more strategic metrics such as cost savings, supplier risk exposure, and compliance, dashboards can become valuable instead of just distracting.
Static Reports Can’t Support Real-Time Decisions
Manual reporting methods like built-in Excel spreadsheets or exports from ERP systems are inherently backward-looking. By the time you share a report, the numbers may already be outdated. That’s not helpful if you need to respond quickly to a supplier delay or budget overrun.
It also complicates audits when data has to be pieced together from multiple versions, and approvals stall as your stakeholders wait for accurate numbers.
Real-time dashboards eliminate these bottlenecks by updating automatically as workflow data changes. Instead of chasing information, you can see spend, supplier performance, and compliance metrics as they happen.
With these updated numbers readily accessible, you can take advantage of automated invoice processing, resolve risks earlier, and make informed sourcing decisions.
So, what procurement dashboard metrics matter most? Let’s go over the KPIs that should be on your dashboard.
The Metrics That Matter On Every Procurement Dashboard
When it comes to dashboard KPIs, the challenge is to focus on the metrics that actually drive enterprise value. The right KPIs highlight where procurement has influence, where governance is breaking down, and where operations need improvement.
Below are four essential metrics every procurement KPI dashboard should prioritize, along with why they matter and what they signal to leadership.
Spend Under Management Tells You Where Procurement Has Influence
Spend under management measures the percentage of total organizational spend actively managed through procurement processes.
High coverage demonstrates that procurement is influencing sourcing decisions, supplier negotiations, and compliance with preferred contracts. Low coverage, by contrast, often signals high levels of maverick spend and contract leakage, where purchases bypass procurement entirely.
Dashboards that surface spend under management provide a clear picture of procurement’s strategic reach, and insight into untapped opportunities for savings.
Compliance Rate and Contract Utilization Reveal Governance Gaps
Compliance rate measures how well purchases adhere to established policies, while contract utilization tracks how often negotiated agreements are actually used. Together, these metrics reveal governance maturity.
Low compliance means higher risk exposure, missed discounts, and potential audit issues, while poor contract utilization suggests stakeholders are bypassing negotiated terms.
Tracking both of these metrics in real time helps you to identify and correct gaps before they escalate. Strong compliance also signals to leadership that procurement is not just delivering savings but reinforcing organizational risk management and audit-readiness.
Learn More in Ivalua’s Guide to Procurement Software Best Practices.
Supplier Performance Metrics Expose Operational Weakness
Supplier KPIs such as on-time delivery, defect rates, and availability provide early warnings about operational risks that help improve supplier risk management.
Poor supplier performance inflates procurement costs and can cascade downstream into production delays, inventory shortages, and customer dissatisfaction.
Dashboards that integrate supplier data can trigger corrective actions such as initiating supplier reviews or launching performance improvement workflows, before issues interrupt business.
Purchase Order Cycle Time Signals Process Efficiency
PO cycle time measures the duration between purchase requisition and order approval.
Long cycle times often point to manual bottlenecks, excessive approval layers, or system inefficiencies. Slow processes delay fulfillment and reduce procurement’s ability to respond to urgent needs.
Dashboards that track cycle time in real time make inefficiencies visible and highlight where automation can accelerate approvals. Shorter cycle times demonstrate to leadership that procurement is supporting the business, not slowing it down.
To put these concepts into practice, the table below outlines key procurement KPIs, their definitions, why they matter, and where to source the data.
| KPI | Definition | Why It Matters | Formula / Data Source |
| Purchase Order Cycle Time | Avg. time from PO creation to delivery | Improves supplier efficiency | ERP data |
| Cost Savings | % saved vs. baseline | Measures procurement effectiveness | Historical spend |
| Supplier On-Time Delivery Rate | % orders delivered on schedule | Tracks supplier reliability | Supplier performance logs |
| Maverick Spend | % spend outside approved process | Reduces leakage | Expense reports |
Designing Dashboards That Actually Get Used
A well-built procurement dashboard design doesn’t succeed just because it looks polished. Rather, it succeeds because people use it.
Too many dashboards fail by overwhelming users with irrelevant visuals or by forcing teams to adapt their workflows to the tool. The reality is that dashboards must adapt to users – not the other way around. Procurement, finance, and business leaders all care about different aspects of performance, and a procurement dashboard template that speaks only to one group will quickly be ignored by others.
To drive adoption, dashboards should focus on usability and cross-functional relevance. Here are some key considerations when building your dashboard:
- Start with clear objectives so every metric ties back to a decision or business goal.
- Align data sources across ERP, P2P, and supplier portals to avoid silos and inconsistencies.
- Ensure cross-functional relevance:
- Finance teams need reliable savings and compliance data.
- Procurement managers look for supplier performance insights.
- Executives want visibility into risk and governance.
- Follow a practical build process:
- Define objectives.
- Identify data sources.
- Select procurement dashboard software (Power BI, Tableau, Qlik, or custom build).
- Map data fields to KPIs.
- Implement automated data refreshes.
- Test and refine with end users.
Dashboards designed with usability in mind will be tools that stakeholders trust, consult regularly, and use to align and execute on strategy.
Align Dashboard Views to Stakeholder Roles and Goals
Different stakeholders engage with procurement data in very different ways, which is why a single “one-size-fits-all” dashboard rarely drives adoption.
For example, finance teams care about cost control, total cost of ownership, and budget variance, so their view should surface reliable savings data and spend forecasts that tie directly into financial planning.
Category managers, on the other hand, need visibility into supplier scorecards, contract utilization, and their sourcing pipeline to manage supplier relationships and ensure negotiated value is realized.
Meanwhile, budget owners in functions like marketing or IT primarily want to track spend against their plans in real time and understand when funds will be available for new initiatives.
Role-based dashboards address the needs of different users by tailoring KPIs, filters, and data visualizations to what matters most to them. Instead of forcing users to sort through irrelevant data, role-based views make it easy to see actionable insights at-a-glance. That way, each function has easy access to the data it needs to manage performance and mitigate risk.
Use Benchmarking Overlays To Put KPIs in Context
While tracking cycle time or compliance rates in isolation can highlight trends, without a reference point, it’s difficult to determine whether performance is strong or weak. Benchmarking overlays add that essential context by comparing metrics against internal or external standards.
- Internally, dashboards can highlight how different business units, regions, or categories perform relative to each other, uncovering best practices in high-performing areas and identifying where support is needed.
- Externally, benchmarking against industry standards or maturity thresholds, such as the percentage of spend under management or acceptable PO cycle times, helps you see how your results stack up against your peers.
By setting reference targets directly in dashboards, you can set realistic goals for improvement and demonstrate progress over time.
Build in Drill-Downs, Not Just Visuals
Dashboards that stop at high-level visuals risk becoming static scorecards. Those are useful for presentations, but they don’t help with day-to-day decision-making.
Effective dashboards support action – and that means enabling users to drill into the data behind the numbers. With drill-down functionality, you can get a spend overview for specific categories and individual suppliers, and even see contract-level details – all within the same interface.
The same applies to operational issues. If a purchase order is delayed, you can check the dashboard to see the full timeline, all of the stakeholders that are involved, and the vendor communications tied to that order. This means you no longer have to manually hunt down answers.
With drill-downs, dashboards can help you solve problems. You can perform root cause analysis faster, maintain a clear audit trail, and implement process fixes in real time.
Automate Data Pulls to Eliminate Manual Errors
Dashboards built on spreadsheets or manually refreshed reports don’t have a lot of credibility. The data gets old quickly and may have errors, and you’ll probably spend more reconciling numbers than acting on insights. In fact, your dashboard can become a liability, slowing down decision-making instead of supporting it.
By pulling data automatically from Source-to-Pay tools and workflows such as requests, approvals, purchase orders, and invoices, dashboards can stay accurate and current without human intervention.
Real-time feeds from supplier scorecards and contract management modules ensure performance and compliance data is always up to date, eliminating the risk of stale or incomplete metrics.
The result is greater accuracy, trust, and speed – everyone can rely on dashboards to reflect the true state of spend, supplier performance, and policy adherence at any given moment. With this data on-hand, they can make decisions quickly and confidently.
Next we explain how to evolve your procurement KPI dashboard from a static report to a strategic performance engine.
From Static Reports to Strategic Performance Engines
For too long, reporting has been backward-looking: monthly spreadsheets cobbled together from disconnected systems, riddled with manual errors, and outdated the moment they’re shared. In a reactive model like this, you are forced to defend your numbers rather than act on them.
When dashboards evolve from static reports into automated, forward-looking performance systems that integrate with Source-to-Pay workflows, you have real-time spend visibility and insights into supplier performance, compliance, and risk exposure.
Automation ensures that metrics are always current, while built-in drill-downs and benchmarking overlays provide context that drives meaningful action.
The real value comes when dashboards are aligned with enterprise strategy. Procurement data no longer sits in isolation but is tied to financial performance, risk management, and ESG commitments. Your dashboard can continuously monitor operations, highlight risks, and surface opportunities for improvement.
Automate Data Pulls To Eliminate Manual Errors
In an enterprise environment, procurement dashboards should connect directly to the systems where data originates:
- Intake and requisition systems provide real-time insights into request volumes and approval bottlenecks.
- PO and invoice modules supply critical metrics such as cycle times, exceptions, and maverick spend.
- Contract management contributes utilization rates, renewal alerts, and compliance adherence.
- Supplier risk and performance modules deliver real-time updates on delivery reliability, financial health, and ESG compliance.
When dashboards aren’t integrated with these systems, you either have to upload spreadsheets manually or reconcile data across silos – a slow and painstaking process that introduces errors and undermines trust in reported results.
By linking dashboards directly to Ivalua’s Source-to-Pay ecosystem, you can eliminate the need for manual uploads while ensuring your KPIs update automatically, providing accurate, real-time visibility across procurement.
Embed ESG And Risk Indicators For Forward-Looking Strategy
Modern procurement dashboards capture sustainability and risk metrics such as the percentage of spend with diverse or local suppliers, and category-level CO₂ emissions per supplier. These ESG metrics help organizations track progress against corporate sustainability goals.
Risk indicators such as supplier financial health, operational resilience, and compliance alerts highlight vulnerabilities that can disrupt business continuity if left unmonitored.
Embedding these indicators directly into dashboards enables continuous ESG and risk management. You can flag exposure early, adjust sourcing strategies, and demonstrate alignment with corporate objectives.
For example, monitoring emissions intensity across suppliers enables your sourcing team to prioritize greener options, while tracking supplier financial risk ensures stability in critical categories, helping your organization meet its goals for sustainable procurement strategy.
Link Procurement KPIs To Finance Metrics That Matter
For dashboards to be adopted at the executive level, your procurement metrics must map directly to finance. For example:
- PO cycle time and supplier on-time payments impact working capital efficiency
- Realized savings and sourcing effectiveness connect to operating margins.
- Contract compliance and supplier consolidation reduce cost of goods sold (COGS).
Procurement dashboards that surface these correlations help finance leaders see procurement as a driver of enterprise financial health.
Also, metrics such as “cost avoidance validation,” “budget variance visibility,” and “cash flow forecasting” provide finance with confidence that procurement is delivering measurable value.
By correlating metrics with financial goals, dashboards can help you build the business case for continued investment in procurement modernization and ensure procurement strategy is tied directly to business growth and efficiency.
Advanced Procurement Dashboard Features & Tools
Advanced dashboards enable predictive insights and strategic alignment, not just KPI tracking. AI and integrated analytics can extend the value of dashboards beyond reporting, giving procurement leaders the tools they need to anticipate risks, improve sustainability performance, and optimize supply chain outcomes.
Let’s take a look at how advanced features augment your e-procurement dashboards.
AI-Driven Spend Forecasting
Traditional spend analysis helps organizations understand historical spend patterns, but advanced dashboards now leverage AI-driven spend forecasting. These models predict future purchasing trends across categories and regions, helping procurement teams anticipate budget requirements, negotiate more effectively, and align sourcing strategies with expected demand.
Supplier Risk Scoring Models
To strengthen resilience, dashboards can embed supplier risk management models that score vendors on financial stability, operational performance, and compliance.
By visualizing these risk scores alongside performance KPIs, you can gain a comprehensive view of supplier health and proactively mitigate risks before they disrupt operations.
Sustainability and ESG Reporting
Sustainability has become a core performance driver, and modern dashboards integrate ESG reporting tools. Metrics such as carbon emissions by category, percentage of spend with diverse suppliers, and environmental impact scores allow organizations to measure progress against corporate commitments.
Embedding ESG into dashboards ensures sustainability is monitored continuously, not only during annual reporting cycles.
Predictive Inventory Management
Advanced procurement dashboards also support supply chain continuity with predictive inventory management. By analyzing demand signals, supplier lead times, and stock levels, predictive models flag potential shortages or overstock risks before they occur.
Then, you can collaborate with suppliers on proactive adjustments to ensure materials availability while reducing excess carrying costs.
Rogers Unlocks Procurement Insights & Dashboards
Rogers Communications, one of Canada’s largest telecommunications and media providers, faced significant procurement challenges stemming from fragmented systems, heavy reliance on IT or third-party vendors, and a complex influx of purchase orders.
These limitations slowed response times, hindered compliance, and created visibility gaps across spend categories and supplier interactions.
With multiple disconnected tools in play, user adoption was low and integrations frequently failed, making it difficult for procurement to operate with agility or deliver real-time insights to leadership.
By implementing Ivalua’s unified procurement platform, Rogers transformed procurement into a more agile, data-driven function:
- Dashboards powered by automated spend categorization now deliver ~98% accuracy, enabling real-time visibility into category-level insights and supplier performance.
- Self-serve configuration tools allow procurement teams to adapt dashboards without IT support
- Enterprise application integration ensures contract renewals, PO tracking, and supplier collaboration flow seamlessly.
The result is not only stronger compliance and efficiency, but also dashboards that provide meaningful, role-based views for stakeholders—driving faster decisions, better supplier management, and broad user adoption across both internal teams and external partners.
“We have successfully moved towards a digitally enabled self‑service model, allowing Procurement to focus more on strategic and high‑value activities. Ivalua has allowed us to improve user experience, drive efficiencies and consolidate activities under a single platform”
— Vijay Jainaraine, Director for eProcurement and Analytics, Rogers
From Better Visibility to Smarter Procurement Decisions
Procurement KPI dashboards have evolved from simple reporting tools into powerful drivers of strategy and business value. Instead of looking backward at static reports, modern dashboards provide real-time, role-based insights that help teams focus on what’s coming next.
By tailoring views to stakeholder needs and linking operational KPIs to broader business outcomes, dashboards turn data into actionable guidance for continuous improvement and smarter decisions.
Here are a few key points to remember:
- Benchmarking overlays provide context for KPIs on dashboards, helping teams define what “good” looks like and track progress over time.
- Automation ensures data accuracy and speed, while reducing the manual errors and delays of spreadsheet-based reporting.
- Embedding ESG and risk indicators into dashboards enables continuous monitoring, aligning procurement with sustainability goals and enterprise resilience.
With the right design and focus, procurement management dashboards can drive smarter, faster, and more strategic decisions across the business.
Unleash The Full Potential of Your Procurement Data With Ivalua
Frequently Asked Questions About Procurement Dashboards
A procurement management dashboard consolidates data from purchasing, supplier, and contract systems into one view so teams can monitor performance in real time. It’s used to spot issues quickly, track progress against targets, and give stakeholders a consistent source of truth.
Focus on KPIs that influence business outcomes, not just activity counts. Prioritize cycle time reduction, realized savings, supplier availability, supplier defect rate, supplier delivery reliability, and compliance rates – metrics that reflect efficiency, value, and risk control.
A procurement dashboard tracks day-to-day operations in real time, such as order cycle times and supplier performance. A spend analysis tool looks backward, analyzing historical data to find savings opportunities and sourcing strategies.
Yes—modern dashboards typically connect to ERP, P2P, and supplier systems via APIs or built-in integrations. This ensures procurement KPIs reflect live data rather than relying on manual uploads or static reports.
The biggest mistakes are overcrowding with too many metrics, pulling from inconsistent data sources, and designing without user input. Dashboards that aren’t role-based or fail to update automatically often go unused.